Website performance monitoring shouldn’t require manual testing. With the PageSpeed Insights node for n8n, you can automate performance audits, track Core Web Vitals, and integrate speed testing into your workflows. This guide walks through installation, API setup, and practical automation examples.
What is the n8n PageSpeed Insights Node?
The @searchops/n8n-nodes-pagespeed package brings Google’s PageSpeed Insights API into n8n workflows. It analyzes web performance, SEO, accessibility, and best practices—returning actionable metrics like Largest Contentful Paint (LCP), Cumulative Layout Shift (CLS), and overall performance scores.
Key capabilities:
- Automated performance monitoring on schedules
- Bulk URL analysis from spreadsheets or databases
- Mobile and desktop testing strategies
- Simplified or complete API responses
- Integration with alerts, reports, and CI/CD pipelines
Installation Methods
Installing via n8n Community Nodes (Recommended)
The fastest installation method uses n8n’s built-in community node installer:
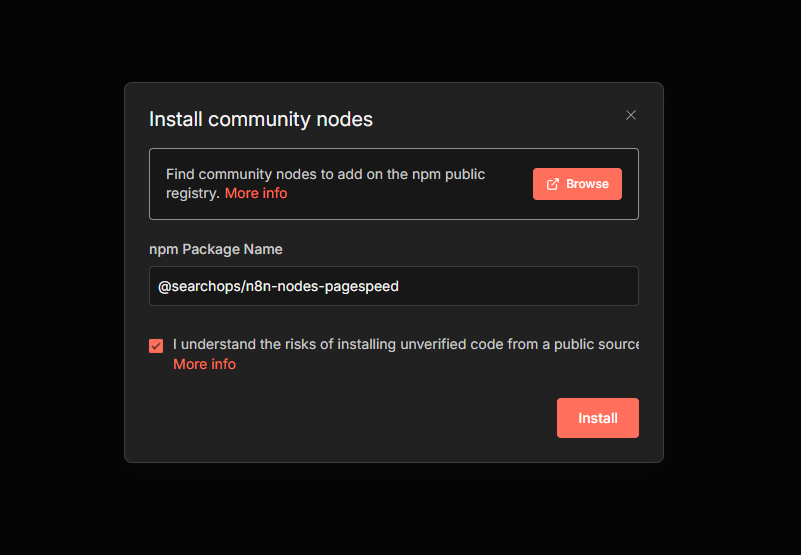
- Open your n8n instance
- Navigate to Settings > Community Nodes
- Click Install
- Enter the package name:
@searchops/n8n-nodes-pagespeed - Review and accept the community node risks
- Click Install
The node appears in your node palette within seconds, ready for use.
Installing via npm
For self-hosted n8n instances with command-line access:
npm install @searchops/n8n-nodes-pagespeed
After installation, restart your n8n instance to load the new node.
Getting Your Google PageSpeed Insights API Key
While the node works without credentials, API keys unlock higher rate limits essential for production workflows.
Step-by-Step API Key Setup
1. Access Google Cloud Console
- Visit console.cloud.google.com
- Sign in with your Google account
2. Create or Select a Project
- Click the project dropdown in the top navigation
- Select an existing project or create a new one
- Name it descriptively (e.g., “n8n-automation-tools”)
3. Enable PageSpeed Insights API
- Navigate to API Library
- Search for “PageSpeed Insights API”
- Click the API name
- Select Enable
4. Generate API Credentials
- Go to Credentials
- Click Create Credentials
- Choose API Key
- Copy the generated key immediately
5. Secure Your API Key (Optional but Recommended)
- Click Edit API Key next to your new key
- Under “API restrictions,” select “Restrict key”
- Choose “PageSpeed Insights API” from the list
- Save your changes
Adding API Key to n8n
- In n8n, create a new PageSpeed Insights node
- Click Create New Credential
- Paste your API key
- Name the credential (e.g., “PageSpeed API – Production”)
- Save
How to Configure PageSpeed Analysis
Basic Configuration Parameters
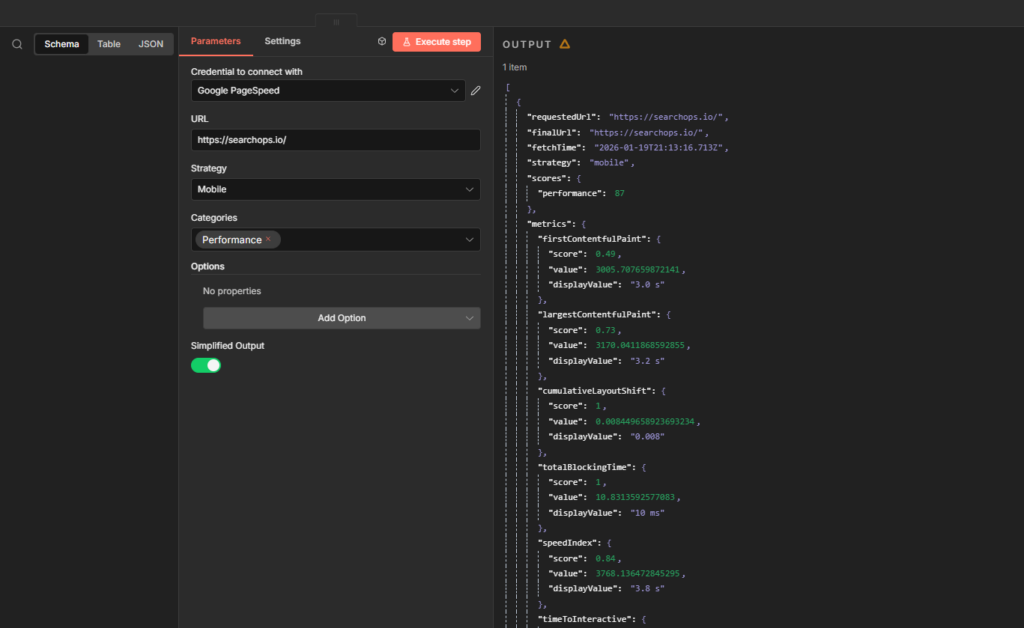
URL (Required) The webpage to analyze. Must include the protocol:
- Correct:
https://example.com - Incorrect:
example.com
Strategy Choose your testing environment:
- Mobile (default): Emulates mobile device with 3G connection
- Desktop: Tests desktop performance
Categories Select which audits to run:
- Performance: Core Web Vitals and speed metrics
- SEO: Search engine optimization checks
- Accessibility: WCAG compliance testing
- Best Practices: Modern web standards
Simplified Output
- Enabled (default): Returns clean, focused metrics
- Disabled: Provides complete API response with all raw data
Advanced Options
Locale Settings Format results in specific languages:
enfor Englishpt-BRfor Brazilian Portugueseesfor Spanish
UTM Parameters Track analysis sessions in Google Analytics:
- UTM Campaign: Campaign identifier
- UTM Source: Traffic source label
Understanding the Output Data
Simplified Output Structure
The default output focuses on actionable metrics:
{
  "requestedUrl": "https://example.com",
  "finalUrl": "https://example.com/",
  "strategy": "mobile",
  "scores": {
    "performance": 95,
    "accessibility": 100,
    "seo": 92,
    "bestPractices": 100
  },
  "metrics": {
    "firstContentfulPaint": {
      "score": 0.99,
      "value": 1234,
      "displayValue": "1.2 s"
    },
    "largestContentfulPaint": {
      "score": 0.95,
      "value": 2345,
      "displayValue": "2.3 s"
    }
  }
}
Score Interpretation:
- 90-100: Good (green)
- 50-89: Needs improvement (orange)
- 0-49: Poor (red)
Key Performance Metrics Explained
First Contentful Paint (FCP) Measures when the first content appears. Good: under 1.8 seconds.
Largest Contentful Paint (LCP) Tracks when the main content loads. Target: under 2.5 seconds for good user experience.
Cumulative Layout Shift (CLS) Quantifies visual stability. Aim for scores below 0.1 to prevent layout jumps.
Total Blocking Time (TBT) Shows how long the page is unresponsive. Keep under 200ms.
Speed Index Indicates how quickly content visually populates. Faster is better—aim for under 3.4 seconds.
Practical Workflow Examples
Automated Daily Performance Monitoring
Goal: Check your homepage every morning and alert if performance drops.
Workflow setup:
- Schedule Trigger – Set to daily at 6:00 AM
- PageSpeed Insights – Analyze your URL with Performance category
- IF Node – Check if
scores.performance < 80 - Slack/Email – Send alert if condition is true
This catches performance regressions before users notice.
Bulk URL Analysis from Spreadsheet
Goal: Audit 50 landing pages monthly.
Workflow setup:
- Google Sheets – Read URL list
- Loop Over Items – Process each URL
- PageSpeed Insights – Run analysis
- Google Sheets – Write scores back to spreadsheet
Perfect for tracking performance across large site sections.
Competitive Performance Comparison
Goal: Compare your site against three competitors weekly.
Workflow setup:
- Schedule Trigger – Weekly on Mondays
- Set Node – Define competitor URLs array
- PageSpeed Insights – Analyze each URL
- Function Node – Calculate average scores
- Database – Store historical comparison data
Reveals competitive advantages and areas needing improvement.
CI/CD Performance Gate
Goal: Prevent deployments that hurt performance.
Workflow setup:
- Webhook Trigger – Listen for deployment events
- PageSpeed Insights – Test staging URL
- IF Node – Check if any score < 75
- HTTP Request – Block deployment or send warning
Maintains performance standards automatically.
Troubleshooting Common Issues
“API Key Invalid” Error
Cause: Key not properly enabled or restricted.
Solution: Verify API key has PageSpeed Insights API enabled in Google Cloud Console. Check for typos when pasting the key.
Rate Limit Errors
Cause: Too many requests without API key or exceeding quota.
Solution: Add API key credentials. For heavy usage, consider adding delays between requests using Wait nodes.
“URL Not Found” Responses
Cause: URL inaccessible to Google’s crawlers or requires authentication.
Solution: Test URL in a private browser. Ensure pages aren’t blocked by robots.txt or authentication walls.
Inconsistent Scores
Cause: Performance naturally varies based on server load and network conditions.
Solution: Run multiple tests and average results. Focus on trends rather than single measurements.
Best Practices for Performance Automation
Test Real User Conditions Use mobile strategy for mobile-first sites. Match your actual user demographics.
Monitor Trends, Not Single Tests Store historical data and track changes over time rather than reacting to individual scores.
Set Realistic Thresholds Don’t aim for perfect 100s on everything. Focus on maintaining good scores (90+) for critical metrics.
Combine Field and Lab Data PageSpeed provides both real user measurements (field data) and simulated tests (lab data). Use both for complete insights.
Schedule Wisely Run tests during low-traffic periods to avoid skewing results with peak server load.
Rate Limits and Quotas
Without API Key:
- Limited to 25 requests per day
- Suitable only for testing
With API Key:
- 25,000 requests per day (free tier)
- Sufficient for most automation needs
For enterprise requirements exceeding free quotas, contact Google Cloud sales.
Integration Ideas
Performance Dashboards Feed scores into Grafana, DataDog, or custom dashboards for visual monitoring.
SEO Reporting Combine with other SEO nodes to create comprehensive site health reports.
Customer Deliverables Generate automated monthly performance reports for clients.
Internal SLAs Track whether development teams meet performance service level agreements.
Why Automate PageSpeed Testing?
Manual performance testing wastes time and misses regressions. Automation provides:
- Consistency: Same testing conditions every time
- Early Detection: Catch issues before users experience them
- Historical Context: Understand performance trends over months
- Scalability: Test hundreds of URLs without manual effort
- Integration: Connect performance data with other business metrics
Resources and Documentation
Next Steps
Start with a simple workflow: schedule a daily test of your homepage. Once comfortable, expand to multiple URLs, add conditional alerts, and integrate performance data into your existing monitoring systems.
The PageSpeed Insights node transforms manual testing into automated intelligence, keeping your website fast without constant manual oversight.